I Had an AWS Elasticsearch Service Outage Today
We had an outage today with the AWS Elasticsearch Service. I figured I would blog about it here just in case anyone might find it instructive, and because I like Elasticsearch so much.
We use Elasticsearch at work purely for logging, so if it goes down temporarily and we lose some logs, it is not a huge deal. All the super important stuff goes into Sql Server or MySql. If you use it for more than logging, you’ll certainly want to set it up differently than I have it setup below (one master node, two others). That being said, I use it all the time, and it has been my chief instrument for understanding this system that I jumped into six months ago. Anyway, let’s jump in.
Problems
The symptom that we first noticed was slowness in some parts of the system. I did not know it at the time, but all calls to Elasticsearch were taking a while (and then failing). A little later we decided to take a look at Kibana (where we keep our logs) to see what was going on and it was completely hosed. At that point it didn’t take log to figure out we had an Elasticsearch-related issue.
The obvious next step was to check the console for Elasticsearch Service in AWS. I did not capture a screenshot in the middle of the kerfuffle (I was a bit busy) but here is one after things had started to recover.
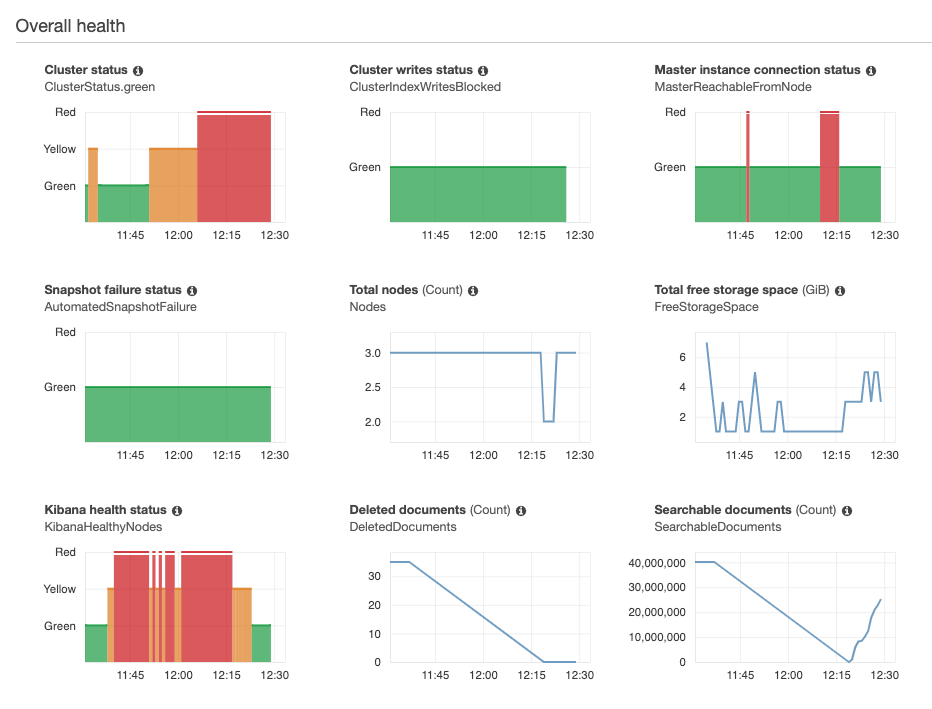
In general with Elasticsearch, green means everything is okay. Yellow/orange means things are working but there are issues, like there aren’t enough nodes for you to have enough copies of all your shards. Red means things are really really bad and you are hosed. Other things you might notice is a general loss of searchable documents (bottom right) and the loss of a node (in the middle).
One of the nice things about Elasticsearch is that it is multi-node, and if you have your sharding and replication correctly setup, you can easily survive the death of a data node. My problem, as it turns out, was not that I lost a data node. Nope, I lost my one and only master node. And that is exactly what Elasticsearch was telling us any time we made a call.
cluster_block_exception
blocked by: [SERVICE_UNAVAILABLE/2/no master]
Or if we made a call to GET /_cluster/health
{
  "error": {
    "root_cause": [
      {
        "type": "master_not_discovered_exception",
        "reason": null
      }
    ],
    "type": "master_not_discovered_exception",
    "reason": null
  },
  "status": 503
}
Dealing With It
On snap! Since this was log data only, the first thing was to just stop sending logging calls to Elasticsearch to get the app back to normal, which meant a couple quick ssh sessions into prod and changes to two lines of code to shut all that off. With that, the site was back to normal speed.
One of the big advantages of a managed service like the AWS Elasticsearch Service is that I didn’t have to do anything to fix this. A few minutes later AWS spun up a new master node, and because Elasticsearch already knows how to rebalance its shards when it loses a node, at that point I just had to wait for things to get back to normal. Here is a picture of the GET /_cat/allocation?v call during this rebalancing process.
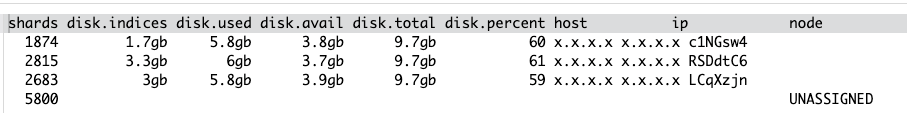
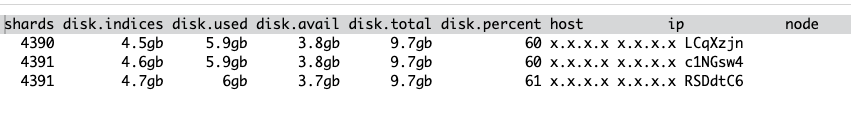
If you have never seen this before, you have one node per line, and the shards will be spread out across all the nodes. Depending on how you have it set up, you might have it generally balanced among the nodes, as is the case for me. And here it is after the fact.
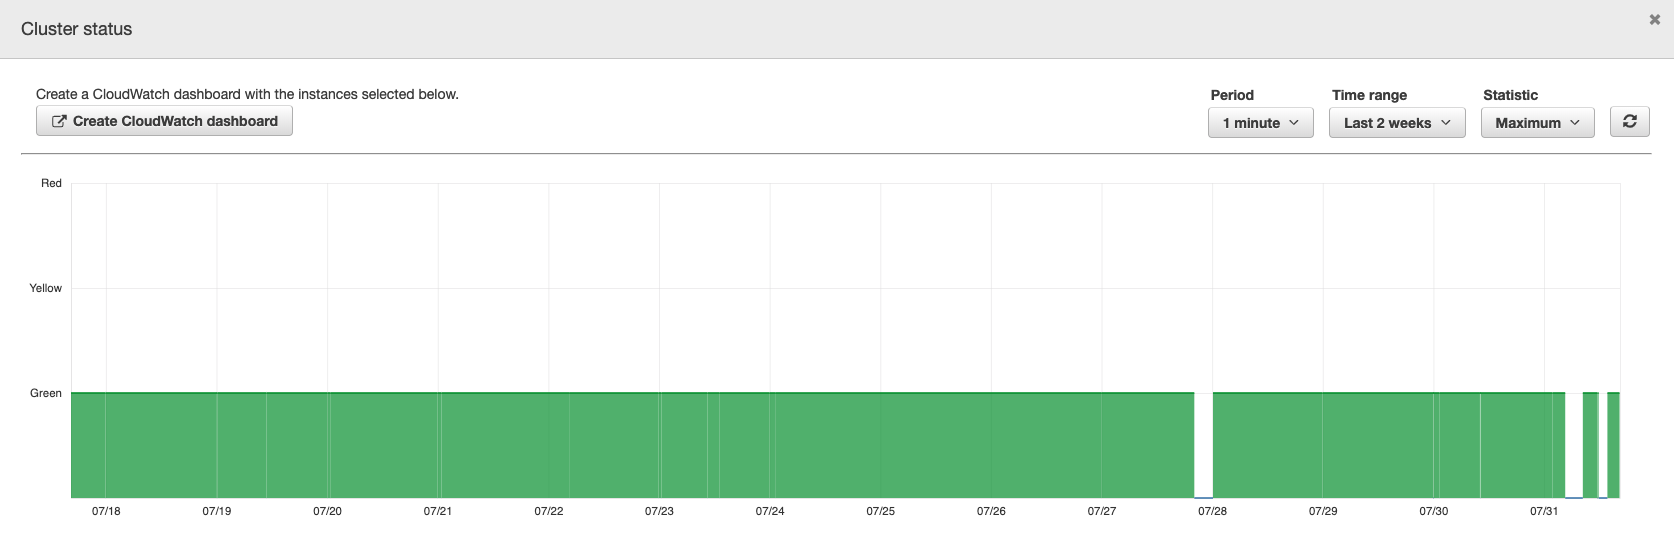
The great thing about all this is that this is basically a self-recovering system, which is pretty handy. But it did make me curious how many nodes I have lost over the last two weeks.
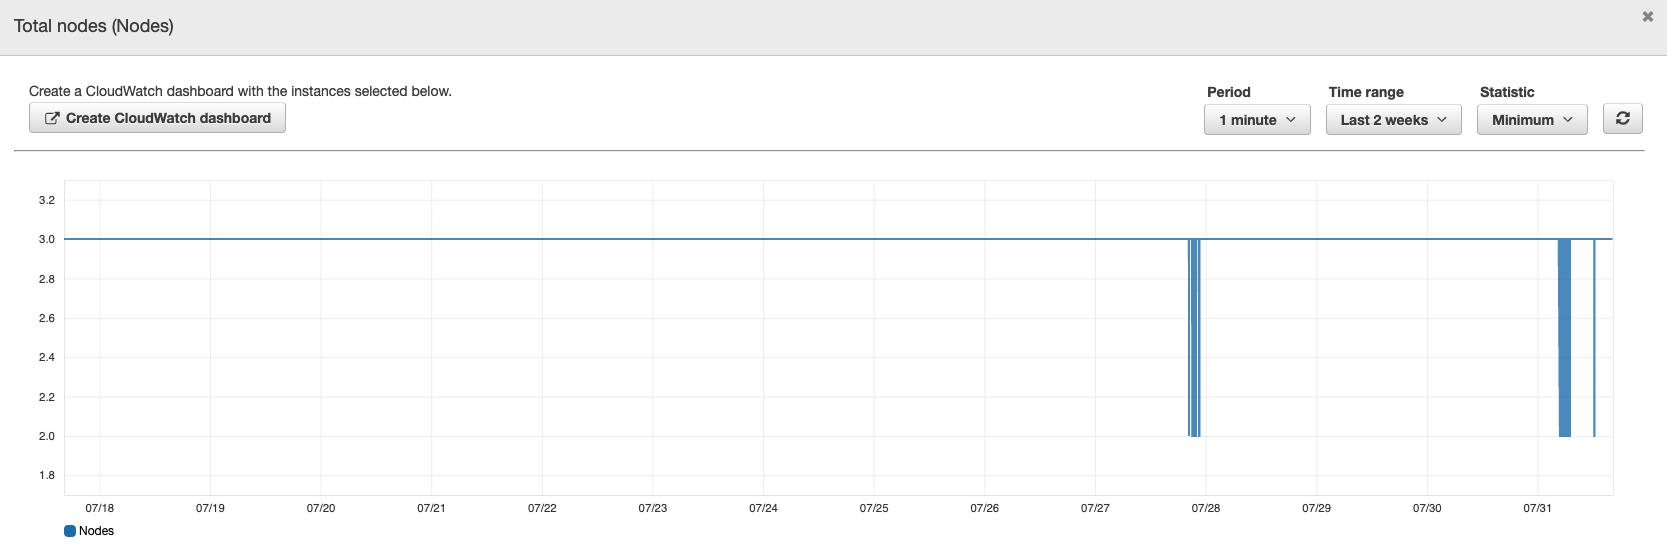
Hrrrrrrrrmmmm. Honestly, it is a little troubling to me that I have nodes come in and out this often. Looking at the other visualizations in the dashboard, I see that the "Cluster writes status" is a complete lie because it didn’t notice my outage today, or any change over the last two weeks. The cluster status graph tells me when all was green but not when it was yellow or red.
The Kibana status, however, seems useful.
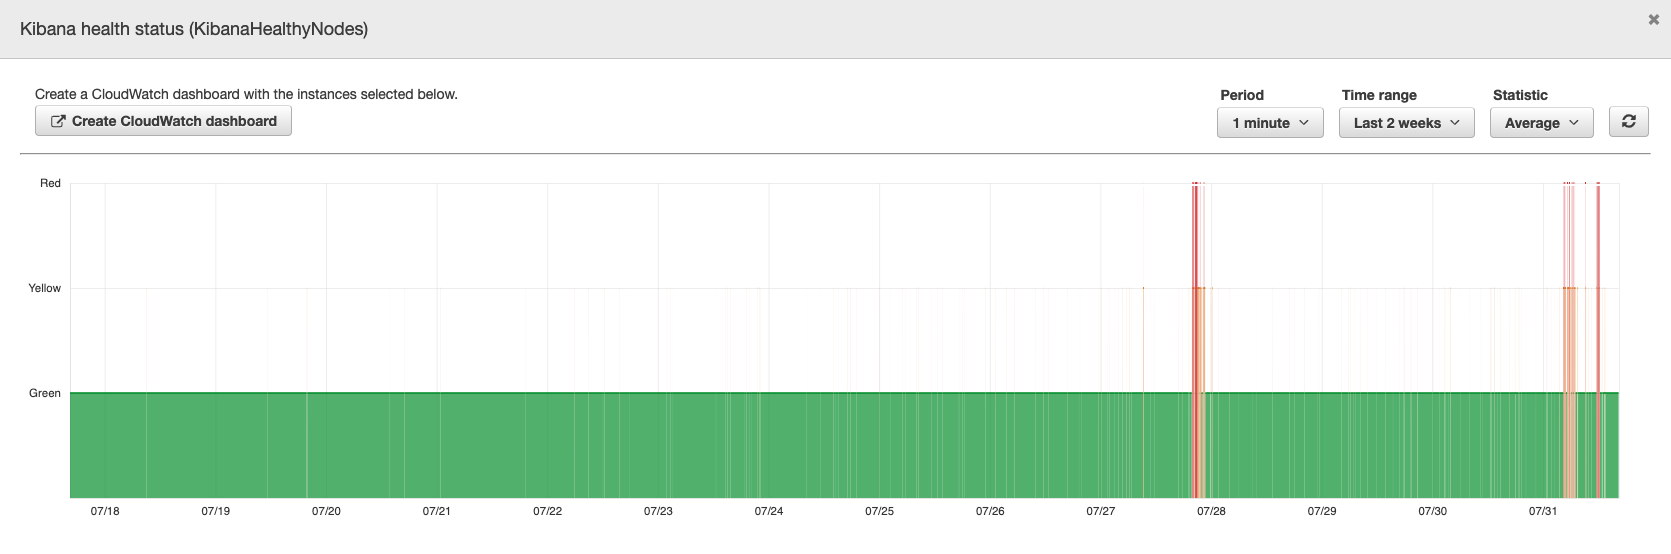
Even though it shouldn’t be the case, the Kibana graph is probably the most beneficial graph for Elasticsearch usability.
Final Thoughts
Fortunately, this had no impact on the customers except a little slowness. We don’t throw exceptions for these errors, so things were able to run pretty well regardless of problems.
I suspect that I could have avoided this outage entirely by just having more master nodes (as my buddy Brett pointed out). It is actually quite easy to configure multiple master nodes in Elasticsearch, and the AWS Elasticsearch Service allows you to do that as well. But that raises server costs, so I am not sure I am going to do that. If this wasn’t just log data, I would have done this already.
I was suprised at the number of failures but pleased with the self-healing ability. As a man with no ops person and a tiny dev team (two of us), fiddling around with operational things is not something we have a lot of time for, so I haven’t decided what I am going to do at this point, if anything. I already have plenty of super important things to deal with.
One obvious improvement would be to move these to asynchronous calls to Elasticsearch. This would at least keep the site from slowing down. But I am on an old version of PHP and Laravel, so this might be easier said than done. There are several things in this combo that I have come to distrust.
A common pattern people follow to write logs to Elasticsearch is to put Filebeat and Logstash between the app and Elasticsearch. So the app would write to STDOUT, then filebeat would pick that up and give it to Logstash, then Logstash would look at it, possibly transform it, then send it to Elasticsearch. This gets rid of the direct connection between app and Elasticsearch, which would have helped me here. We did this a lot at the last job. But this is certainly not something I am going to do anytime soon. It adds more work for me now and adds more moving pieces to the system, complicating it. At the moment I am trying to simplify things, not complicate them. I have a small team. Simplicity of the system is paramount, and that setup sends me in the opposite direction of where I want to go.
That is it for now. May your nodes be abundant and your clusters fruitful.
comments powered by Disqus